If you have managed to venture out of your home in the past week, you may well be forgiven for thinking that life looks increasingly “normal”. Pubs and restaurants are now open, retail stores are open and there just seems to be a lot more people and traffic about. Much similar to the property market too:
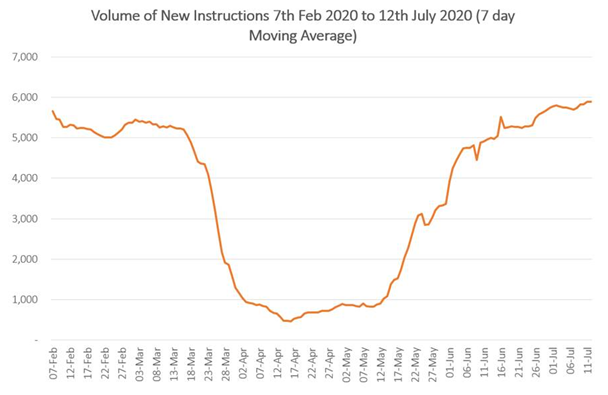
The chart shows the February to Mid-March pre-lockdown norm in terms of properties coming to the market For Sale. Then Covid-19 takes hold in the UK, Boris starts a period of lockdown and we see an immediate dip in the number of new properties coming to the market. However, then from 13th May onwards, we’ve seen numbers of new instructions eventually returning to pre lockdown numbers and then even higher.
The number of sales being agreed in the UK looks very similar to the number of new instructions, when graphed in the same way:
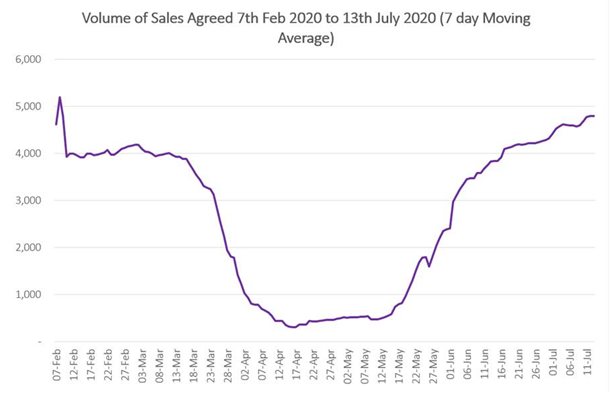
Again, we see a pre-lockdown “norm”, followed by a massive trough which then increases week on week, day by day, to where we are today – seeing pent up demand and more transactions being agreed than pre-lockdown!
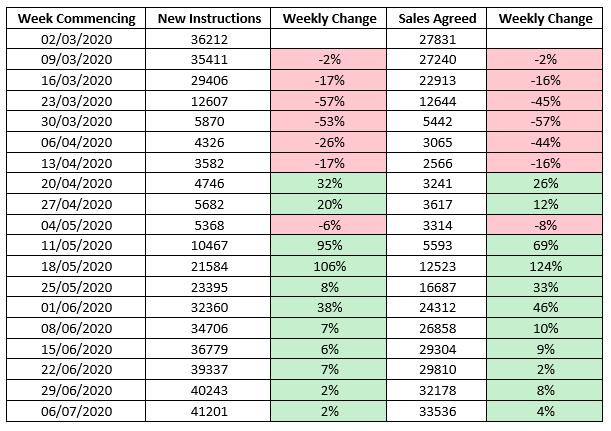
Here’s the week on week sales data: